Asset Rich But Cash Poor? The Truth Behind Taiwan’s 2024 Household Wealth Distribution and Generational Assets
In our previous article, we discussed "individual salaries," but does a high salary mean you're wealthy? In 2024, the Directorate-General of Budget, Accounting and Statistics (DGBAS) released its long-awaited "Household Wealth Distribution Statistics." This time, the unit of measurement changed from "individual" to "household."
Key Difference: Salary measures your "cash flow generation capacity," while household assets measure your "wealth resilience (savings, stocks, real estate minus liabilities)." When we separate these two perspectives, we discover that Taiwan's most cruel social divide is actually hidden in asset statistics.
Why Is the “Right-Skew” in Assets More Extreme Than in Salaries?
If the extreme values in salary statistics are tech executives, then the extreme values in assets are “land, factories, and corporate equity.” These types of assets appreciate far faster than ordinary labor wages, causing the average household asset figure across Taiwan to be pulled up to an almost unbelievable number.
| Statistical Item | Overall Average (Mean) | Overall Median | What the Data Reveals |
|---|---|---|---|
| Taiwan Household Net Worth | 16.38 million NT$ | 8.94 million NT$ | The median is barely half the average! As many as 71% of households have wealth below the average, meaning the extreme asset accumulation of the ultra-wealthy has made the overall average meaningless as a reference for ordinary people. |
🏘️ Profile of Households Above the Median (8.94 Million NT$)
When we use 8.94 million NT$ as the dividing line and overlay population and household characteristics from the Ministry of Interior, we discover that households crossing this threshold look very different from high-salary earners:
- Age Distribution (Elderly as the Dominant Force): Wealth accumulation requires long time horizons (paying off mortgages, investment compounding). Households where the head is aged 50 to 65+ overwhelmingly fall on the right half; meanwhile, young households under 30 are almost entirely below the median.
- Geographic Distribution (Urban-Rural Gap Determined by Real Estate): A huge proportion of Taiwan’s household assets are tied up in real estate. Simply owning a low-mortgage home in northern metropolitan areas or core redevelopment zones in central and southern Taiwan easily pushes household net worth across the 8.94 million threshold.
- Occupational Distribution (Business Owners and Self-Employed Enter the Picture): Traditional wholesalers and factory owners in central and southern Taiwan—excluded from salary statistics—become the core force pushing up extreme asset values here.
🧐 Deep Dive: Business Blind Spots and Generational Deprivation You Didn't Expect
- Asset-Rich But Cash-Poor (Nothing Left But the House): Many elderly households bought Taipei apartments at low prices decades ago, now sitting on impressive paper assets but with minimal monthly disposable cash. If e-commerce or service businesses target them with high-priced consumer goods just because they're "high-asset," conversion rates will be terrible. What they need are "asset monetization tools (like reverse mortgages)" rather than simple products.
- Debt Deduction and Asset Inflation: DGBAS data shows "net assets" (total assets minus total liabilities). A tech worker who bought a 30-million NT$ home with a 25-million NT$ mortgage has only 5 million in net assets. When looking at assets, you must simultaneously consider the debt ratio of each age group.
- Hidden Generational Deprivation: The 8.94 million household median seems decent, but when you break down household composition, wealth is extremely concentrated in the older generation. If young people have no family inheritance to rely on (the "waiting for inheritance" tribe), salary alone makes it extremely difficult to cross this threshold. This is a critical classification for business decisions: Is the money in customers' pockets self-earned or inherited? The consumption psychology and communication language are completely different.
📈 Visual Analysis: Assets and Population Ratio by Age Group
Notice the two horizontal reference lines in the chart: you'll see the "overall asset median (8.94 million)" sitting very low, while the "overall average (16.38 million)" floats high above. Additionally, to present the real situation, the under-30 segment doesn't show asset lines because they haven't become primary household heads or are in the early accumulation phase where liabilities exceed assets. This lets you focus on the wealth compounding curve that develops after age 30.
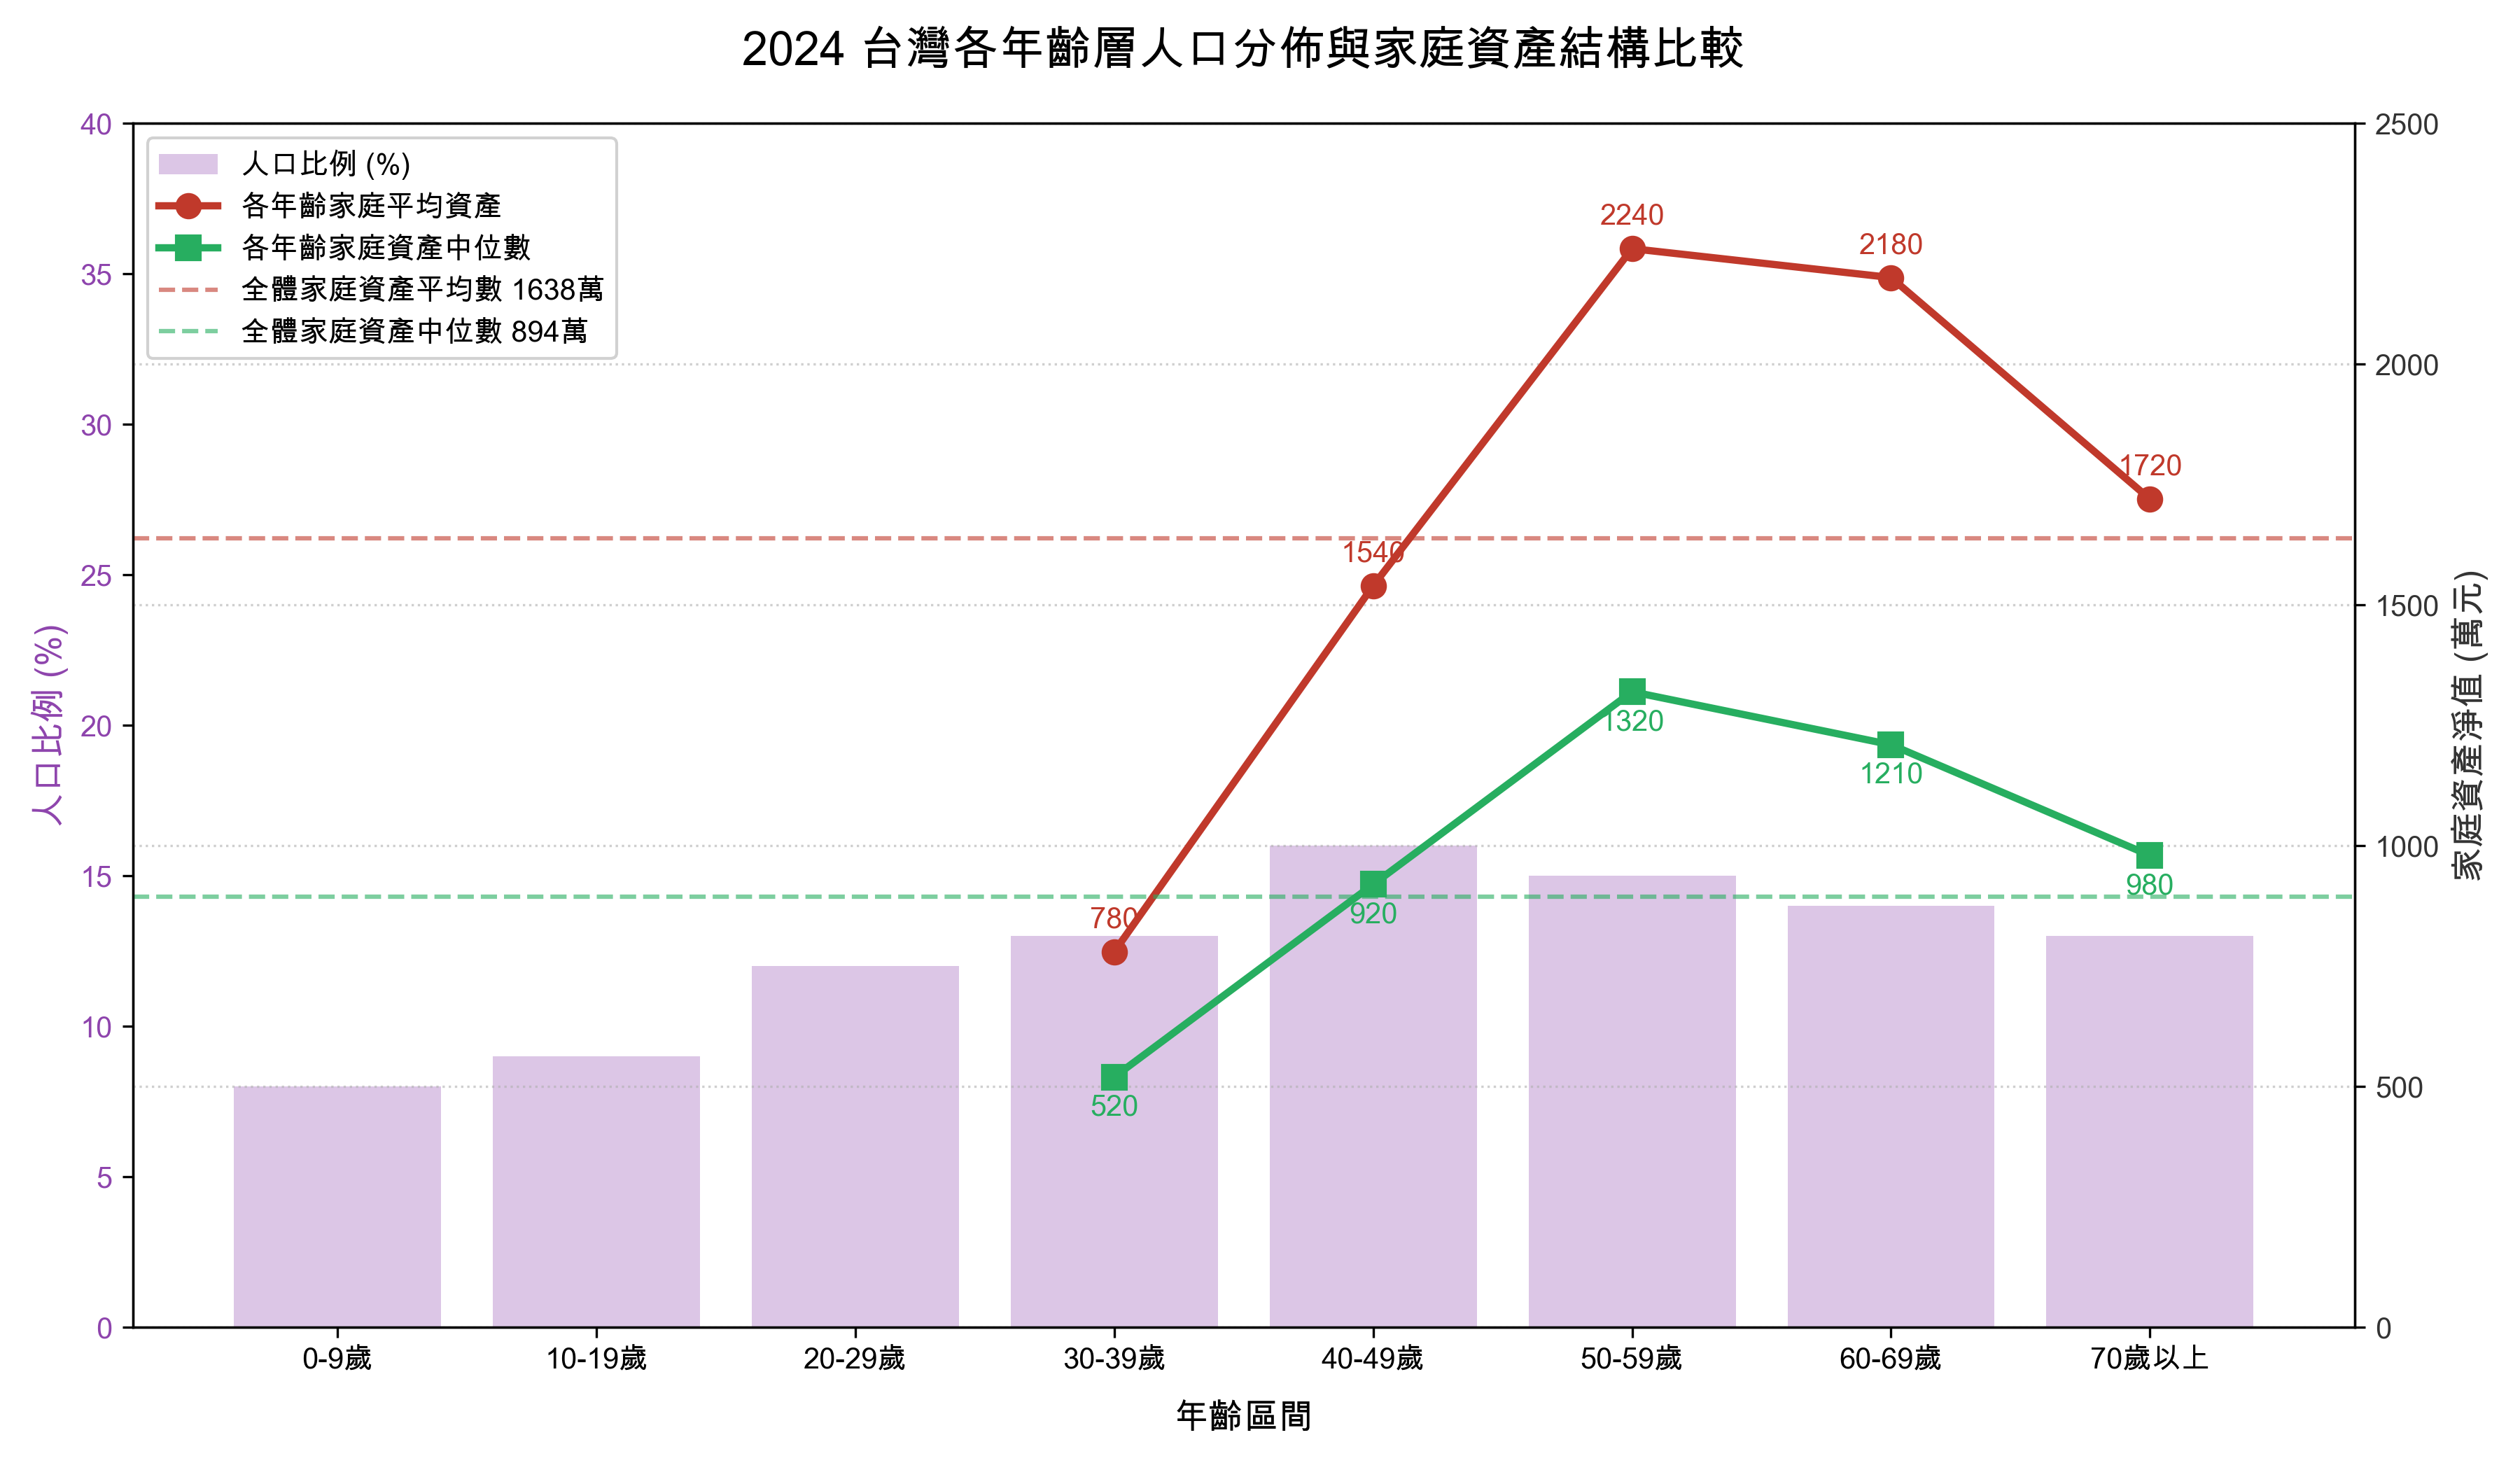
Data Source: Ministry of Interior Population Statistics, DGBAS Household Wealth Distribution Statistics
🎯 Conclusion: The Truth About Wealth Lies Not on Paper, But in Liquidity
When we see “Taiwan’s household asset median of 8.94 million NT$,” it’s easy to assume Taiwan society is generally wealthy. But once we break down the underlying structure, we find these assets are extremely concentrated among middle-aged and elderly groups, and mostly locked up in real estate, lacking liquidity.
For the younger generation, without family asset inheritance, salary alone makes it extremely difficult to cross the asset median threshold in a short time. This is a crucial dividing line for business decisions and information architecture: Is the money in customers’ pockets self-earned or inherited? The consumption psychology, risk tolerance, and marketing communication language are completely different between these two groups.
When designing products and defining target customers, don't assume "high assets" means they have spending power. You must simultaneously consider asset liquidity, generational differences, and debt structure.
• High-asset but low-cash-flow retirees are better suited for "asset monetization tools" rather than high-priced consumer goods.
• Young high-earners may have low assets but strong cash flow—they're the main force for subscriptions and high-frequency consumption.
• The "waiting for inheritance" tribe's spending power comes from expected inheritance, with higher risk tolerance for future planning.
Data isn't just numbers—behind data are living households and generational choices.