The Truth Behind the Data: The 2024 Taiwan Salary Median and Mean Myth
Recently, many people have been emphasizing the "median," but looking at a single median value isn't very useful. Take an extreme example: if you put my salary, the president's salary, and Jensen Huang's salary together, the average would definitely be over a hundred million; but if you calculate the median, since Jensen Huang's influence is too large, although extreme values are flattened, the excluded impact should also be considered.
My question: Why can the Directorate General of Budget, Accounting and Statistics (DGBAS) provide both mean and median, but never provide the "mode"—the statistic that best represents most people's situation? When we look at the median and mean together, what do we discover?
Clarifying Statistical Misconceptions: Why Do We Feel “Deprived”?
Many people mistakenly think the median is “the middle between the maximum and minimum values” (that’s actually called the mid-range). The true definition of median is: when you arrange everyone in Taiwan “from lowest to highest,” the value of the person standing exactly in the middle. This means the median deeply cares about “how many there are.”
When looking at salary data, Taiwan displays a very typical “right-skewed” distribution. Because the left side (salary of $0 or minimum wage) has a floor limit, but the right side (business owners, tech industry executives) has no ceiling. This tiny group of high earners forms a long right tail, pulling the “mean” forcefully to the right. Therefore, the vast majority of people are concentrated on the left side (low-salary zone), and the mean is far greater than the median.
📊 2024 Taiwan Salary Data Evidence and Population Characteristics
According to the DGBAS 2024 total annual salary statistics for employees, we overlay this with the Ministry of Interior’s population pyramid for cross-analysis:
| Statistical Item | Overall Mean | Overall Median | Meaning Behind the Data |
|---|---|---|---|
| Employee Total Annual Salary | NT$732,000 | NT$546,000 | The difference is nearly NT$200,000. A staggering 68.75% of employees earn below the mean, showing severe right-skewed salary structure. |
When we use NT$546,000 as the dividing line, we find that high-earning groups who cross this median line have the following distinct population characteristics:
- Age Distribution (Inverted U-shape supported by middle-aged workers): The 40-49 age group not only has higher probability of earning high salaries (median NT$620,000), but also represents the largest absolute number supporting the right half. Young people under 30 largely fall below the median on the left half.
- Gender Distribution: Male annual total salary median (NT$585,000) is higher than female (NT$512,000), reflecting Taiwan’s industrial structure where males are more concentrated in high-paying industries (tech and manufacturing).
- Geographic Distribution: High-median populations are highly concentrated geographically toward northern science parks (Hsinchu County and City) and the capital’s financial business district (Taipei City).
🤔 Deep Dive: Knowledge Points You Didn't Expect and Survivorship Bias
- Bonuses are the core differentiator: If you only look at monthly salary (regular earnings), the median is around NT$37,000-39,000. The key that lets these people break through NT$546,000 or even the million-dollar threshold is year-end bonuses, performance bonuses, and profit sharing. If you ignore bonus structure in your analysis, you can't explain why some positions with mediocre monthly salaries can still stand firmly in the high-median zone.
- The 40-49 salary peak has survivorship bias: Behind this age group hides changes in labor participation rates. Some low-wage or atypical workers may have exited full-time employment during this period due to family factors (childcare, eldercare). Those remaining in the statistical sample are mostly those with stable careers who have been promoted to management positions. Looking only at numbers over-beautifies the actual economic situation of this age group.
- Why no mode? Salary is a "continuous variable." With millions of workers, finding two people with exactly the same salary down to the last digit is extremely unlikely. Therefore, DGBAS instead uses "decile distributions" or "frequency distribution charts" to present modal ranges, which is more meaningful than a single number.
📈 Visual Analysis: Salary and Population Ratio by Age Group
To more intuitively see each age group’s relative position in society, we introduce a “global ruler”—the overall mean and median reference lines. You’ll notice the median reference line is clearly lower than the mean, confirming how extreme high earners pull the overall average line upward.
The following chart combines Ministry of Interior population distribution with DGBAS salary data. Bar charts show each age group's population ratio (since under 20 and over 70 are not primary employed labor, their salary lines are not displayed). You can clearly see that 40-59 not only has the largest population share, but is also the only cohort that can steadily cross the "overall mean" red line.
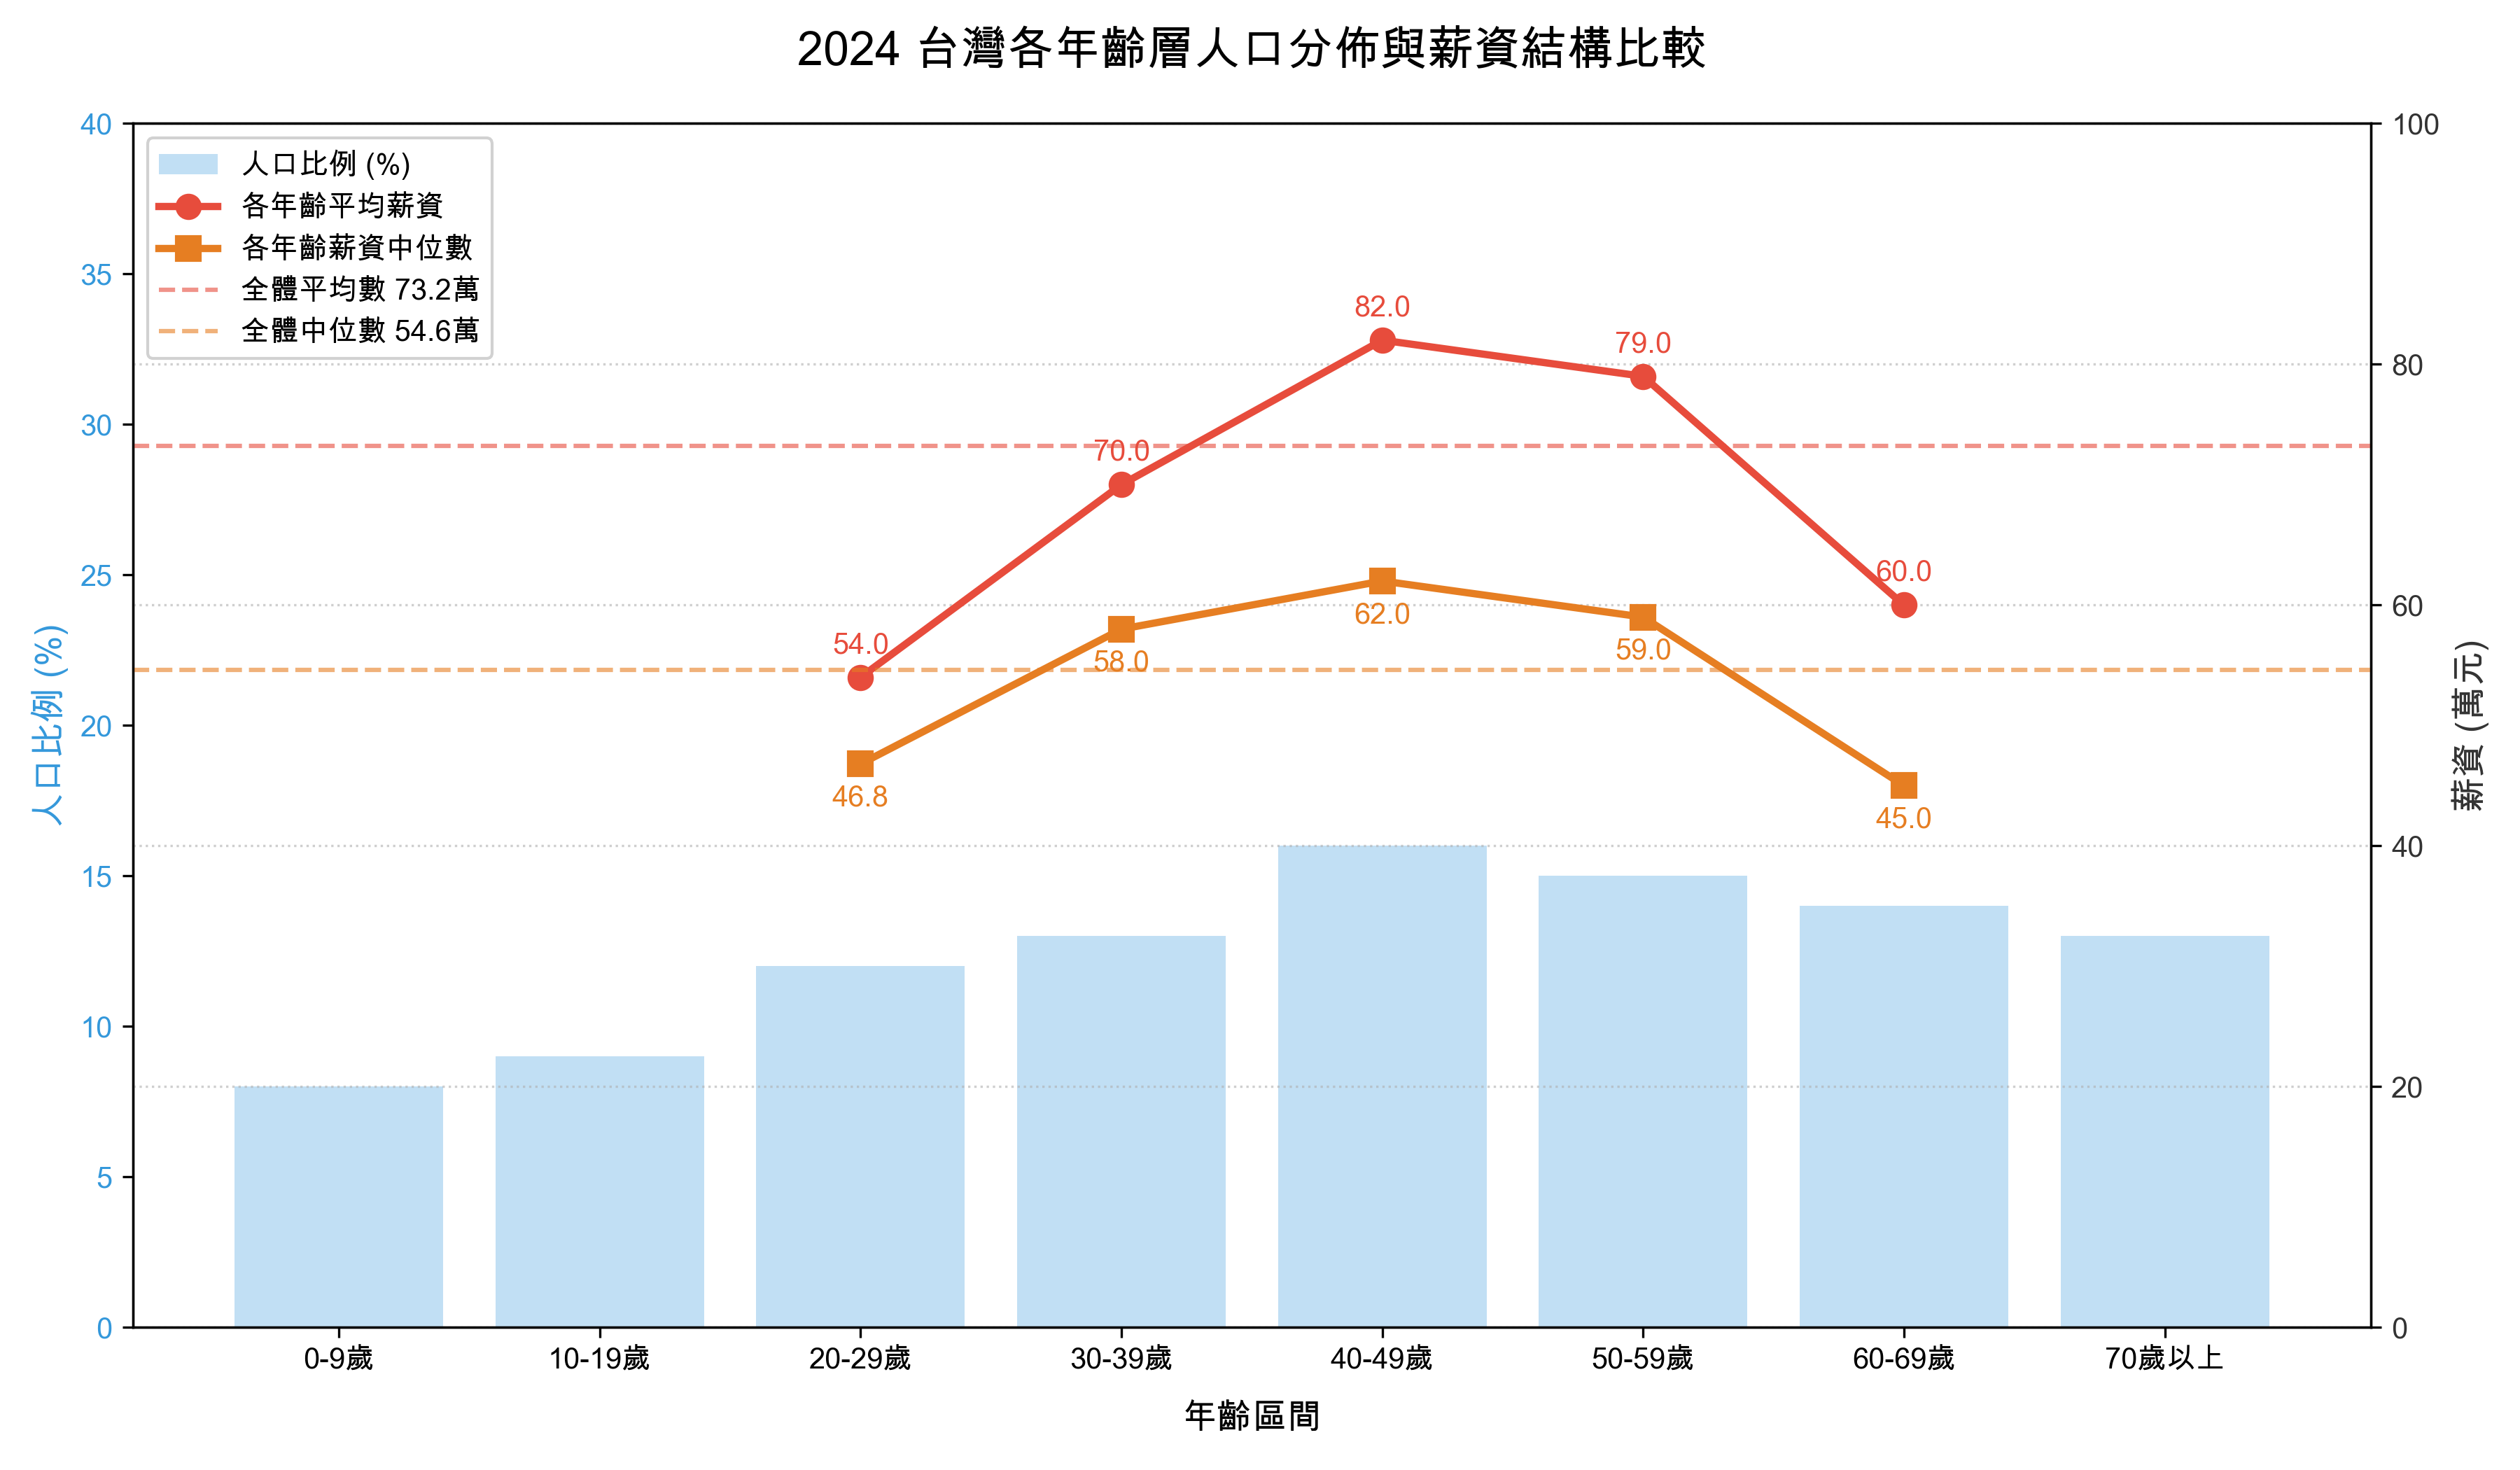
Data sources: Ministry of Interior Population Statistics, DGBAS (2024)
🎯 Conclusion: See the Data, But More Importantly, See the People Behind It
When we simply look at “mean NT$732,000,” it’s easy to get the illusion that “salary levels are high.” But when you see the median is only NT$546,000, you understand this average is forcefully elevated by a tiny minority of high earners. More importantly, by overlaying population structure, we can see wealth accumulation peaks in middle age, but this curve carries not just salary, but also bonus structure, labor participation rate changes, and survivorship bias.
When designing information architecture, defining user profiles, or doing market segmentation, never just look at the mean. You must overlay median, decile distributions, and population structure to truly understand where your target customers are and where their pain points and purchasing power are distributed.
Data isn't just numbers—behind the data are real, living people.